When inspecting an audio master in digital audio workstations, the level meters often show maximum peaks resting at 0.0 dBFS or -0.1 dBFS. On a laptop screen, the file appears completely clean. Yet when that same track is played through the digital-to-analog converters of a high-power club installation, the sound develops a harsh, brittle glaze across the high frequencies.
This distortion is caused by intersample peaks. Discrete digital sample points miss the continuous analog waveform peak created when consecutive samples pass through the DAC reconstruction filter. This tutorial shows how to visually diagnose and inspect these peaks using Waveforge's Waveform Comparison HUD.
Step 1: Inspect Track Metrics in the Audio Meter
Select any track from your library table to open the Track Inspector side panel.

The inspector panel surfaces four critical measurements:
- Integrated Loudness: The gated average perceived loudness across the entire composition.
- Short-Term Max: The highest 3-second energy window, highlighting whether a drop or chorus is excessively squashed.
- Loudness Range (LRA): The statistical distribution between verse and drop sections.
- True-Peak Hardware Meter: A real-time readout powered by 4x oversampled sinc interpolation with a 1.5-second peak-hold tick.
If the true-peak reading displays positive decibels (such as +1.8 dBTP), the track will force club DACs past their physical voltage rails, generating acoustic distortion.
Step 2: Launch the Waveform Comparison HUD
Click the Compare Waveforms button located in the inspector header.
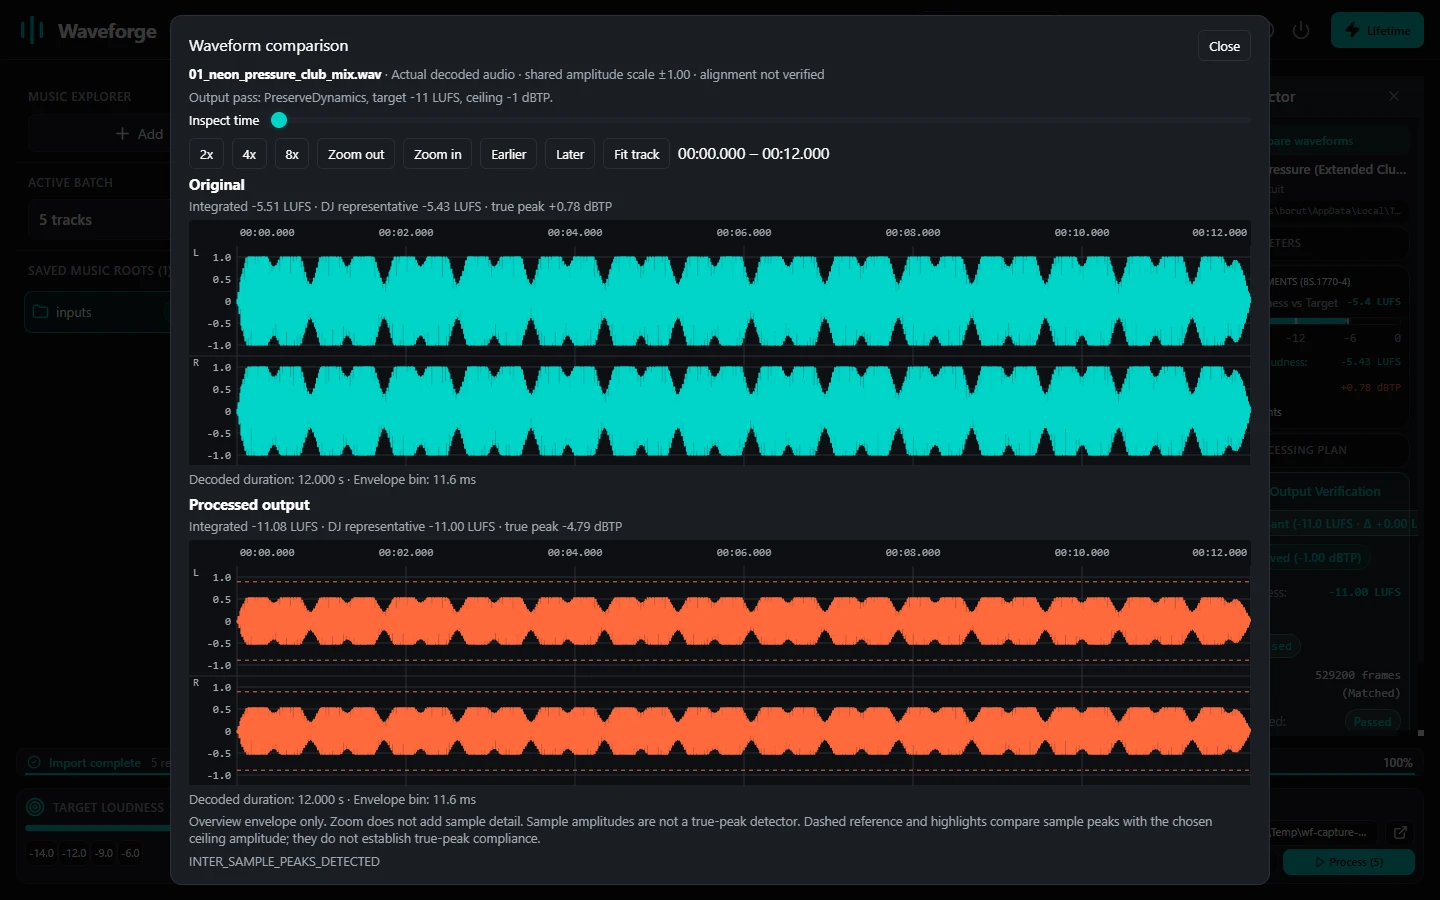
The HUD opens a modal dialog featuring two vertically stacked waveform lanes:
- Top Lane (Source Audio): The unprocessed master rendered with full reconstructed peak excursion.
- Bottom Lane (Calibrated Output): The processed result produced by Waveforge's local DSP pipeline.
Both lanes share synchronized timecode scrolling. Moving your mouse across the timeline updates a floating telemetry readout showing exact minute, second, and instantaneous amplitude in dBFS.
Step 3: Read the -1.0 dBTP Ceiling Guideline
Across both waveform lanes, Waveforge draws a horizontal red dashed guideline at exactly -1.0 dBTP.
In the source lane, look for dense transient spikes that break through this ceiling line. Notice that these peaks often occur during complex sections where high-frequency cymbals and sharp snare transients overlap heavy bass waveforms. Intersample interpolation reveals these peaks even when the raw PCM sample points stayed under 0 dBFS.
In the bottom output lane, inspect how Waveforge constrains these peaks. In PreserveDynamics mode, the entire waveform is scaled downward linearly, pulling the highest peak cleanly below the -1.0 dBTP threshold without rounding off the waveform crest.
Step 4: Verify Dynamic Punch and Crest Factor
Before clearing a track for performance, zoom into the primary drop section using the timeline controls. Confirm that:
- Transient spikes retain their steep, needle-like definition rather than appearing clipped or squared off.
- Quiet breakdown sections remain proportionally balanced with the drop.
- The highest excursion in the entire file touches or rests below -1.0 dBTP.
Once confirmed, close the HUD. Your calibrated file is ready for performance on any sound system without risk of converter clipping.
Inspect Your Crates with Waveforge
Get studio-grade loudness calibration and true-peak protection for macOS and Windows. 100% offline, zero subscriptions, lifetime licence.
GET WAVEFORGE LIFETIME · €34.99 EUR